Trade the first fair value gap inside the Silver Bullet hour (10:00–11:00 New York) and price reaches 2R often enough to be a durable edge; the 2022 model (liquidity sweep, market structure shift, fair value gap) does the same after the open.
No registered finding. A mechanical test of two ICT models on almost seven years of one-minute Micro Nasdaq futures: no cell met all four registered thresholds against a resampled random-path baseline. The validation check failed as written and the 2022-model overnight levels differed from the registration; both are disclosed below.
Pre-registration
Pre-registered on
- Instrument
- Micro E-mini Nasdaq-100 futures (MNQ), front month, back-adjusted
- Period
- 2020-01-01 to 2026-09-04 (in-sample 2020–2023, out-of-sample 2024–2026)
- Data source
- Databento, CME Globex MDP 3.0, one-minute OHLCV, per contract
How claims are specified, judged and corrected is set out in the methodology.
Results
Verdict: No registered finding
Published on
The short version
No cell met all the registered finding thresholds. Two departures from the registration come first, because they bear on how far to trust the numbers:
- The calibration gate failed as written. The registration required every synthetic-data cell with at least 100 trades to show |z| < 2.5 and |gap| < 2 percentage points before any real bar was scored. Four of 34 qualifying cells fell outside tolerance. Scoring went ahead anyway; see “How this was run”.
- The 2022-model overnight levels differed from the registration. The registration defines the overnight high and low over 18:00–09:29 New York time. The code computed them over 00:00–09:29, leaving out the 18:00–23:59 evening bars. This affects the 2022-model cells in both registrations. The Silver Bullet rules do not use these levels. The numbers below are those the study code produced.
I wrote down mechanical rules for two ICT setups, froze them, and ran them on every eligible New York trading day from 2020 to September 2026 on Micro Nasdaq futures. The question was: starting from the close of the fill bar, among fills that were not stopped on that bar, does price reach the target before the stop more often than resampled random price paths would?
In the reported implementation, no cell met all four thresholds. Across 44 cells, in-sample and out-of-sample, the largest z-scores (+2.43 in-sample, +2.36 out-of-sample) belong to placebo hours (04:00 and 12:00), not to the Silver Bullet or 2022-model cells.
The time-of-day test: I ran the identical Silver Bullet rule in the 19 other tradable clock hours. Pooled, those hours win 35.25% of trades in-sample against a baseline of 35.23%, and 35.55% against 35.73% out-of-sample. The 10–11 hour ranks 19th of 22 in-sample and 5th out-of-sample. The results do not single out the Silver Bullet hour.
Failing to qualify can reflect an absence of predictability, a measurement problem, or both. This test cannot separate them.
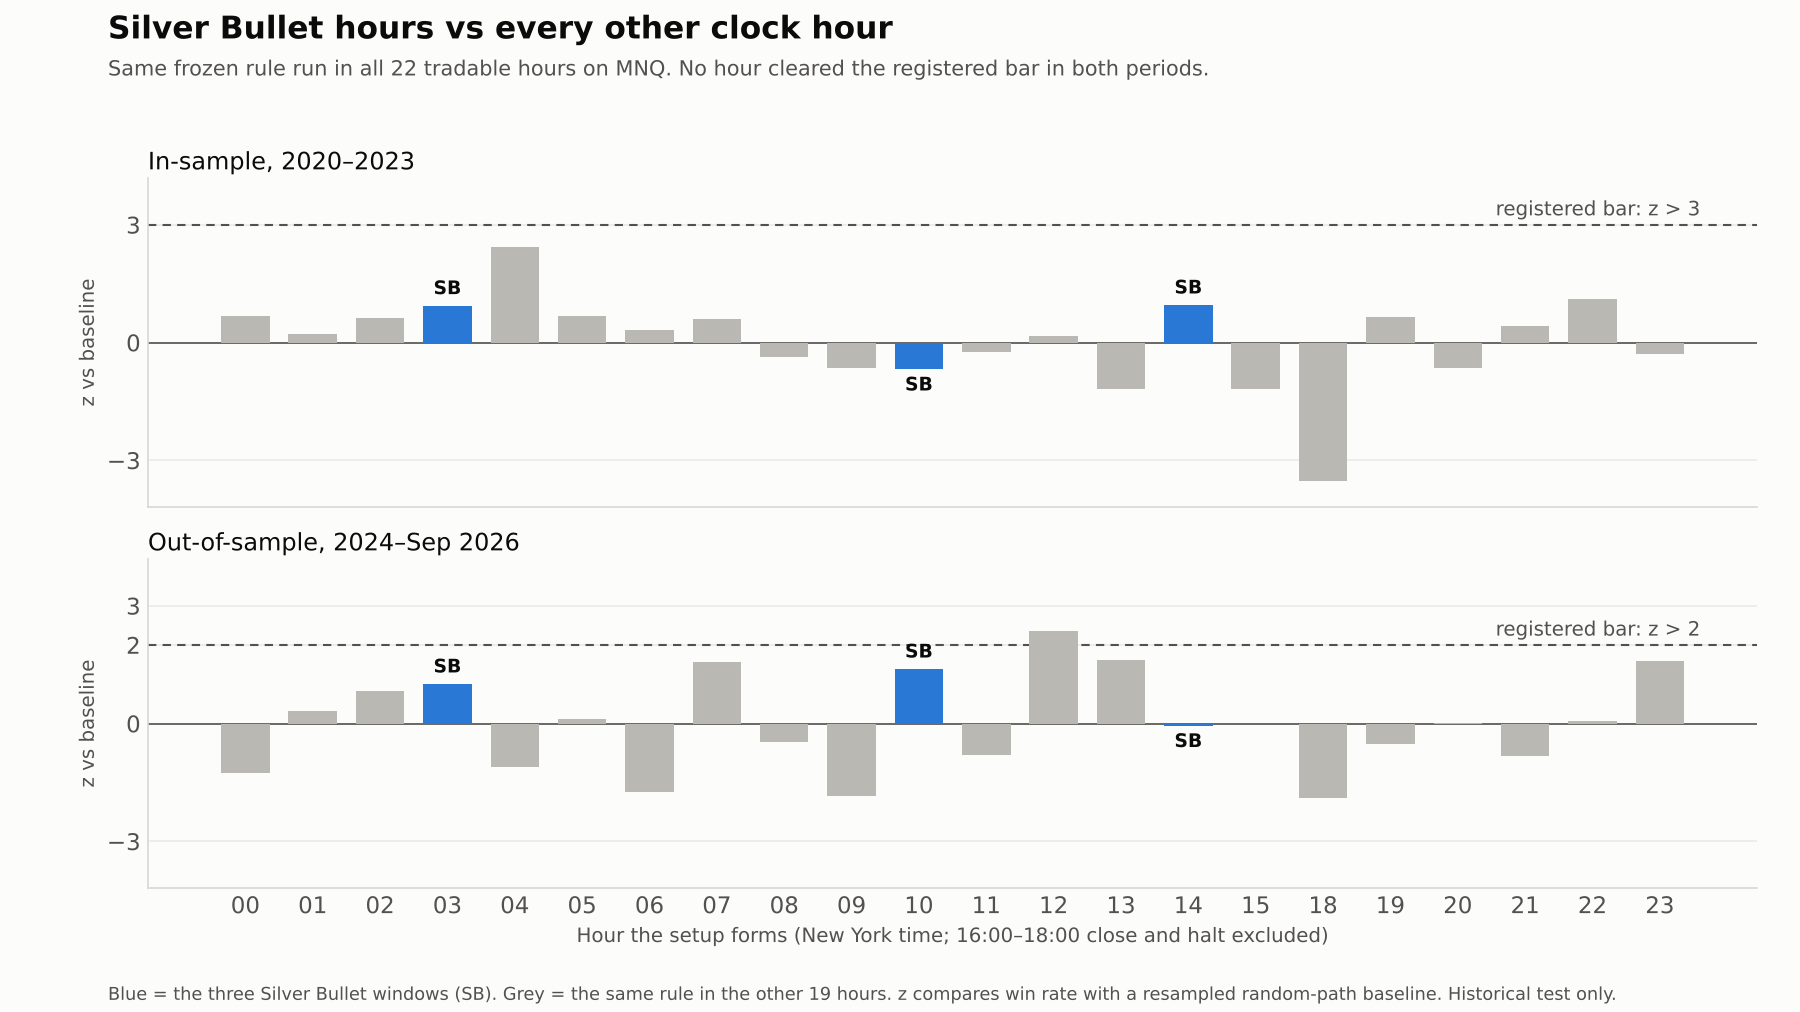
What exactly was tested
Silver Bullet, as specified before any data was scored:
- Windows: 03:00–04:00, 10:00–11:00 and 14:00–15:00 New York time, each scored separately, with daylight saving handled.
- Setup: the first three-bar fair value gap, in either direction, that completes inside the window.
- Entry: a limit order at the near edge of the gap. If price never returns before the window closes, there is no trade.
- Stop: one tick beyond the extreme of the three-bar pattern.
- Target: 2R. Time exit: flat 60 minutes after the window closes.
- Three variants, each one change: entry at the gap midpoint; the stop at the far edge of the gap; a minimum gap size.
- Two bias filters: the direction of the prior day’s candle, or of the session so far.
The 2022 model:
- Sweep. Between 09:30 and 11:00, price trades through the outermost of the reference levels (prior-day high or low, overnight high or low).
- Market structure shift. A close, on the sweep bar or later, through the most recent confirmed reference swing that existed at the sweep.
- Fair value gap. The first gap in the trade direction, from the sweep bar to a few bars after the shift. It can form before the shift is confirmed.
- Entry. A limit order at the gap edge, placed only after both the gap and the shift are confirmed.
- Stop and target. The stop is one tick beyond the extreme of the sweep. The target is 2R.
- Variants. One places the stop at the far edge of the gap. One targets the next liquidity level instead of 2R. One uses a shorter swing lookback. A lunch-hour placebo and an afternoon replication were included.
Swing points and fair value gaps follow the open-source smartmoneyconcepts definitions, made causal so that no label uses a bar that had not closed.
Costs: $1.40 round-turn commission per contract, and one tick of slippage on stop and time exits. Dollar figures are per fill on one MNQ contract, net of costs.
The baseline
The baseline is built from the market itself:
- For each trade, bars are drawn at random from real MNQ one-minute history, across the full supplied data. The bars come from the fill’s clock hour and the following hour.
- Each drawn bar is expressed relative to its prior close and scaled by that day’s volatility in the window, then rescaled to the trade’s pre-entry volatility.
- Each bar’s sign is flipped with probability one half.
- Paths start at the close of the fill bar and run through the engine’s stop, target and time-exit rules.
The share of paths reaching the target before the stop is the win rate the setup is compared with. For the primary canonical cells it is approximately 31–37%. Cells with tight stops have substantially higher baseline win rates.
One known inconsistency: when a trade’s fill bar closes beyond the target, the baseline counts it as a certain win, but the engine does not allow a target hit on the fill bar. This affects 411 of 39,438 z-test-eligible cell-trade rows in the first study.
A cell counts as a finding only if all four hold:
- in-sample z above 3;
- out-of-sample z above 2;
- a win-rate gap of at least 5 points in both periods;
- positive net expectancy in both periods.
Fills and scored trades
Most cells report two counts. Fills are all filled entries. Scored trades are the fills in the z-test. Fills stopped on their own fill bar are excluded from the z-test, because the test conditions on the fill-bar close. Win rates and z use scored trades. Dollar figures use all fills.
Results: Silver Bullet
| Window | In-sample: scored trades, win % vs baseline, z | Out-of-sample: scored trades, win % vs baseline, z | Net $ per fill (IS / OOS) |
|---|---|---|---|
| 03:00–04:00 | 794, 35.4 vs 33.9, +0.94 | 552, 37.7 vs 35.7, +1.01 | −$1.67 / +$0.12 |
| 10:00–11:00 | 828, 33.8 vs 34.9, −0.68 | 560, 38.4 vs 35.7, +1.39 | −$2.11 / +$5.67 |
| 14:00–15:00 | 826, 36.1 vs 34.6, +0.95 | 549, 36.6 vs 36.7, −0.05 | −$3.09 / +$1.39 |
No Silver Bullet cell (three windows × the canonical rule and three variants, plus the bias-filtered cells) met the finding rule. No in-sample z among the twelve grid cells exceeds +1.53.
Far-edge stop. With the stop at the far edge of the gap, 44–51% of fills are stopped on the fill bar under the simulation’s conventions, and all six of these cells have negative net expectancy per fill. Out-of-sample z in the 10–11 window is −3.03 (−$5.80 per fill); in the other five cells z lies between −0.88 and −1.83.
Results: the 2022 model
As first specified, and with the overnight levels as computed (see above), the 2022 model is rare:
- 117 fills (115 scored trades) in about 6.7 years, out of 3,322 opportunities (each day × long and short). 2,484 had no qualifying sweep.
- In-sample z −0.51 (60 scored trades); out-of-sample z +0.70 (55 scored trades).
The out-of-sample cell shows +$22.22 per fill over 56 fills. A figure like that gets screenshotted, so I registered a second test before running it.
The re-registration (13 September 2026) is descriptive by its own terms. It re-used data whose out-of-sample result motivated it, so its own section 0 says it cannot give a verdict. It declared two changes: any of four reference levels (prior-day high, prior-day low, overnight high, overnight low) may be swept, and the window start moves from 09:30 to 08:30. It quadrupled the sample:
| Fills (scored trades) | Net $ per fill | |
|---|---|---|
| Original rule, out-of-sample | 56 (55) | +$22.22 |
| Wider rule, out-of-sample | 196 (186) | +$4.65 |
| Wider rule, whole period | 492 (472) | +$2.44, z +0.21 |
The wider rule’s z of +0.21 is far from the registered bar of 3. The lunch-hour placebo scores z −0.32 over the whole period. The +$2.44 is already net of costs (gross +$4.19). The four control cells reproduce the original study’s fills, win counts and dollar figures exactly. Their z-scores differ by up to 0.105, because the baseline simulation is redrawn in each run.
What this does and does not say
It says: in the reported implementation, no Silver Bullet or 2022-model cell met all four registered thresholds, in any of the three windows, with or without the variants and bias filters.
It does not say:
- anything about discretionary ICT trading, higher-timeframe narrative, order blocks, or any rules outside the frozen specification;
- that fair value gaps carry no information;
- anything about other instruments or periods;
- that the baseline is exactly calibrated. It is not; see below.
How this was run, including what went wrong
-
The specification was frozen privately, not published first. The freeze is reported in the results document as 5 September 2026, before this site’s claim pages existed. The site’s standard is to publish before the test runs, and this study did not meet it. Redacted copies of the frozen documents were published on 19 October 2026 and are not currently public; in them, local paths, personal names and material unrelated to the test were redacted, each redaction marked, and no rule, threshold, number or date was edited. The freeze itself is privately reported, not independently evidenced.
-
The baseline was replaced before scoring. The registered baseline was a Gaussian random walk. On synthetic bars with no structure it failed the gate in 20 of 34 qualifying cells (37 scored): by up to about 5 points on Silver Bullet cells and about 10 on 2022-model cells. Amendment A2 replaced it with the resampled baseline above, as a dated amendment.
-
The replacement baseline also failed the gate as written. With 4 seeds × 1,000 synthetic days, four qualifying cells fell outside tolerance:
Cell Synthetic trades Gap (pts) z PL_00 (placebo hour) 3,185 −2.06 −2.55 M22_AM_V3 140 −7.05 −1.86 M22_PM 129 −3.95 −1.01 M22_LUNCH 101 +3.72 +0.85 Scoring went ahead. Extra checks were run after the failure: the three 2022-model cells were re-run on 6 seeds × 3,000 synthetic days, where every gap was within about ±2 points and every |z| was below 1. The results document records this as decided before any real bar was scored. These checks do not change the gate’s failed status.
-
Overnight levels. As described at the top, the study code that produced the numbers uses an overnight definition that departs from the registration.
-
Cells. The first registration scored 44 cells: 12 Silver Bullet grid cells, 6 bias-filtered Silver Bullet cells, 19 placebo hours, and 7 2022-model cells (one bias-filtered). The re-registration scored 10 cells (six re-specified, four controls).
-
Re-run. On 19 October 2026 the study code, run on the same bars, reproduced all 88 first-study summary rows and the re-registration summary. This was the same author, data and code. It shows that the code reproduces the reported numbers, not that its logic is right. The Gaussian-baseline failure above was regenerated during that run, since no copy of the original was kept.
-
Data and code. CME data can’t be redistributed, so the bars are not published. The study code is not currently public.
Limitations
- Baseline and engine inconsistency. The baseline counts a fill bar that closes beyond the target as a certain win, while the engine allows no target hit on the fill bar (411 of 39,438 z-test-eligible cell-trade rows).
- Overnight levels. Described at the top. The 08:30 start of the re-registration is paired with overnight levels computed through 09:29; 47 of its 492 fills entered before 09:30. Whether any of those depends on bars after the entry has not been shown or ruled out.
- Fill conventions (incidence counts measured in the 19 October 2026 re-run):
- A stop exit is recorded at the stop price even when the bar opens beyond it (7 of 24,810 stop exits, one tick each).
- 2 of 44,043 cell-trade rows have an invalid stop/entry/target ordering.
- 2,214 of 4,194 midpoint-entry fills were set at a price between ticks.
- For the 2022-model level-target variant (M22-V2), target selection uses the session extreme including the fill bar.
- Date table. The registration’s annual eligible-date counts sum to 1,659, but its text describes data to 4 September 2026. The table matches the data through 1 September; the scored first-study set is 1,661 dates and the re-registration’s is 1,659.
- Validation. The calibration gate failed as written for both baselines. The freeze date is privately reported.
- Post-hoc diagnostics. Post-hoc diagnostic incidence counts (the counts in this section) are included here. Post-hoc sensitivity performance results are not. Both were produced after scoring and are not part of the registered test.
Files
The registration documents, full results tables and study code were published on 19 October 2026 and are no longer public. The figures on this page are the record. See the correction above.
Corrections
- — The study's code repository and redacted registration documents, linked from this page since 19 October 2026, are no longer public. The links and the statements that the code was public have been removed; the reported numbers are unchanged. The chart was also replaced: the earlier version drew z = +3 as the out-of-sample bar (the registered bar is z > 2), and its title overstated the result.